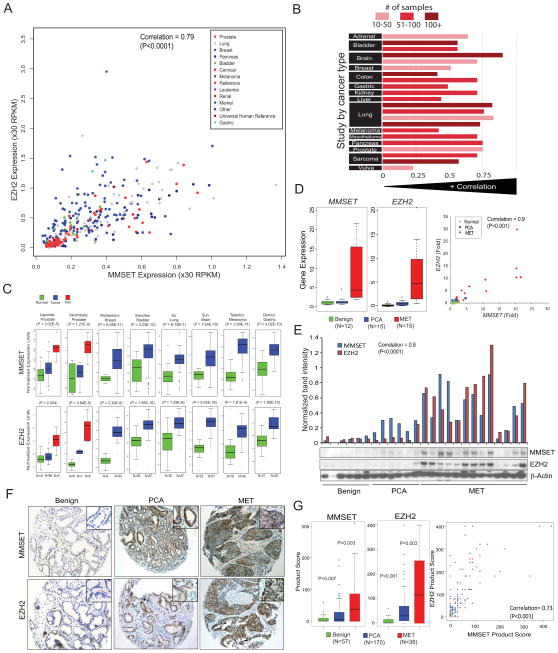
Figure 1. MMSET and EZH2 are coordinately overexpressed and associated with tumor progression across cancer types.
(A) MMSET and EZH2 transcript expression levels are positively correlated across an RNA-seq (transcriptome) compendium of human tumors and cancer cell lines (n=474). The scatterplot displays the expression values in RPKM (Reads Per Kilobase per Million). (B) MMSET and EZH2 transcript expression across 22 microarray-based gene expression studies (n = 1,755) representing 15 tumor types. The histogram displays the correlation score within an individual study while bar shading indicates the number of samples used to calculate each correlation score. (C) MMSET and EZH2 transcript expression in multiple solid tumors based on Oncomine analysis. First author and statistical significance for respective studies are indicated. (D) qRT-PCR and (E) immunoblot analysis of MMSET and EZH2 transcripts and protein in a test cohort of benign prostate, clinically localized prostate cancer (PCA, and metastatic prostate cancer tissue (MET). Band intensity by densitometry is represented as a bar graph above the immunoblot. (F) Representative tissue microarray images depicting immunostaining pattern for MMSET and EZH2. Inset represents 40X magnifications. (G) Tissue microarray analysis of MMSET and EZH2 protein expression (left panel). Overall staining for each marker was measured by multiplying staining percentage (0–100%) by staining intensity on a numerical scale (none=1, weak=2, moderate=3, strong=4), resulting in an overall product score. Also see Table S1, S2, Figure S1.

