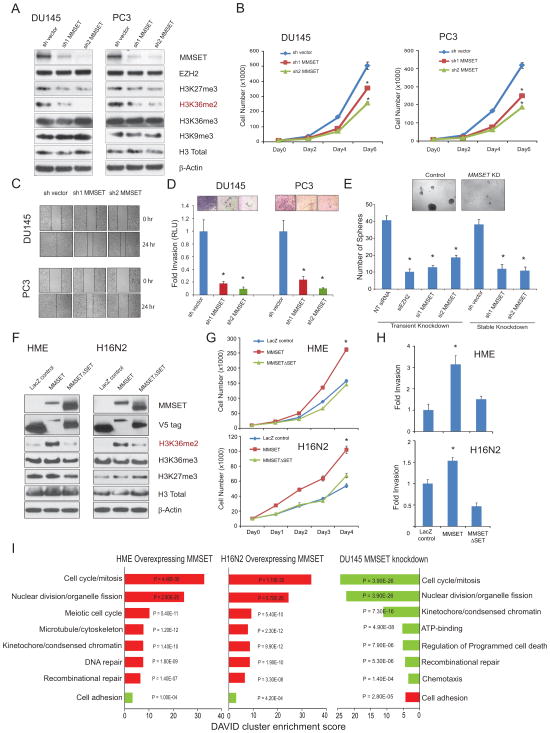
Figure 5. MMSET overexpression promotes cell proliferation, self-renewal and cell invasive phenotype.
(A) Immunoblot analysis of MMSET, EZH2 and different histone methylation marks in stable MMSET knockdown cells. (B–D) MMSET knockdown in DU145 and PC3 cells exhibit reduced cell proliferation (B), reduced cell migration as assessed by wound healing assay (C), and reduced cell invasion as monitored by Matrigel invasion assay (D) with representative images of invaded cells shown in the inset. (E) Prostatosphere formation by DU145 cells is decreased by transient or stable knockdown of MMSET. Cells transfected with siEZH2 were used as a positive control. Representative images of prostatospheres formed by control or MMSET knockdown cells are shown. (F) Overexpression of MMSET but not its SET domain mutant specifically induces H3K36me2 in HME and H16N2 benign epithelial cells. LacZ overexpression was used a control. (G, H) MMSET overexpression induces increased cell proliferation and cell invasion respectively in HME or H16N2 cells. Mean ± SD shown with *p<0.01 (Student’s t-test) for all experiments. (I) Gene ontology analysis of MMSET overexpression and knockdown microarray data using the DAVID program. Red bars represent the top significant hits for upregulated genes. Green bars represent the top hits for downregulated genes. DAVID enrichment scores are plotted with P values. Also see Figure S5.

