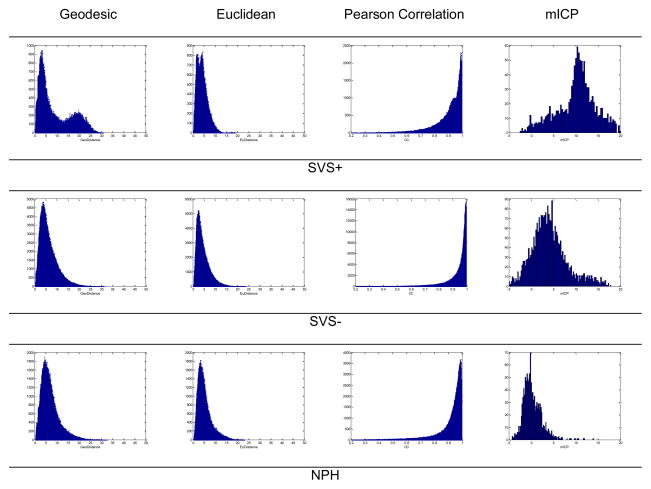
Figure 5.
Histograms of the four metrics including inter-pulse geodesic distance, Euclidean distance, correlation coefficient, and mean ICP corresponding to one example from each of three groups SVS+, SVS−, and NPH, respectively. The appearance of multimodal histogram is a potentially strong marker of SVS+ group.

