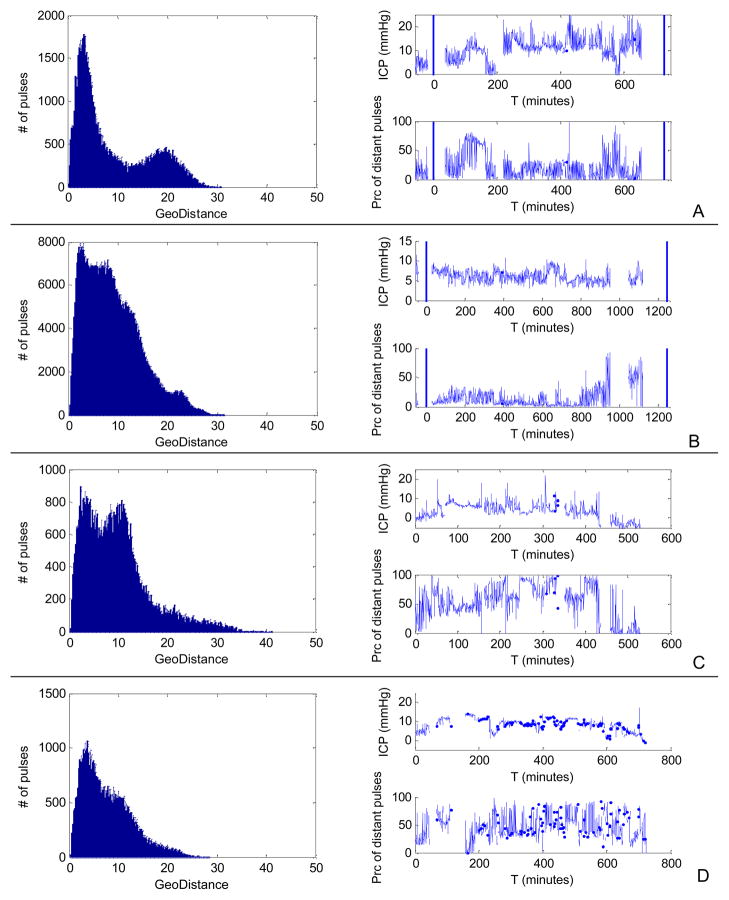
Figure 6.
Two SVS+ (A and B) and two NPH (C and D) cases with multimodal histograms of inter-pulse geodesic distance as examples to show that multimodal histogram of inter-pulse geodesic distance is not necessarily associated with abnormally high ICP. In addition to mean ICP trend, we also display the time series of the percentage of distant (geodesic distance > 15 mmHg for SVS+ and > 7 mmHg for NPH) pulses. For the two SVS+ cases, two vertical lines are used to show the timing of the two consecutive brain imaging studies. It is noted that there were localized periods when the ICP pulses had large number of distant pulses for the SVS+ cases. Such an observation is not held for the NPH cases. The two NPH cases shown here were also the only ones with multimodal histograms.

