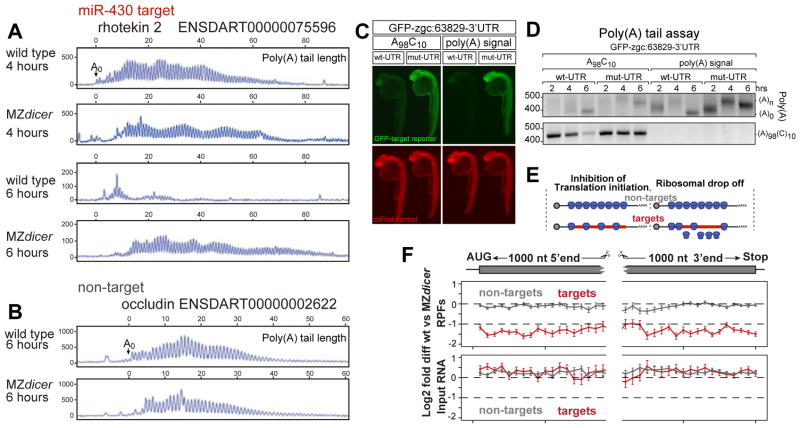
Figure 4. Poly(A) length and ribosome distribution.
(A, B) Single nucleotide resolution electrophoresis for poly(A) length for a target (A) and non-target (B) in wild type and MZdicer (14). A0 represents the polyadenylation site confirmed by DNA sequencing (fig. S9). (C)GFP expression (green) from an injected miR-430 reporter mRNA containing the 3′UTR for zgc:63829 with wild type (wt-UTR) or mutated (mut-UTR) miR-430 sites. The 3′UTRs are followed by an internal poly(A) tail (A98C10) or a polyadenylation signal. Expression of a co-injected dsRed control mRNA is shown in red. Note the repression of the wild-type reporter compared to the mutant reporter when a internal polyA tail is used. (D) Gel electrophoresis of a PCR to determine the length of the poly(A) tail (ending in A, upper panel) and A98C10 (below). Note the polyadenylation by 2hpf and deadenylation by 6hpf, but deadenylation of the mRNA with the internal polyA tail (A98C10)is delayed. Estimated size of the deadenylated product is shown as (A0). (E) Two models for translational repression: reducing translation initiation (left) or causing ribosome drop off/slower elongation rate (right). (F) Plot showing relative RPF read density (top) and mRNA density (bottom) along the length of miR-430 targets (red) undergoing >1.5-fold translation repression at 4hpf; and non-targets (gray). Points show mean +/− SEM log2 fold differences between wild type and MZdicer expression in 50nt bins spanning the first and last 1000 nts of the genes (14). Bins represent 41≥N≥277 genes for targets, 107≥N≥906 genes for non targets. Bin values do not significantly differ (p=0.53, Friedman rank sum test).

