Table 2.
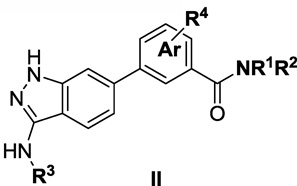
SAR of 3-amino-1H-indazol-benzamides (II)
 | |||||
|---|---|---|---|---|---|
| Cellular antiproliferative activity (EC50, µM)a |
|||||
| Compds | Structure | MOLM13 (FLT3) |
PDGFRα- T674M-Ba/F3 |
Kit-T607I Ba/F3 |
wt-Ba/F3 |
| 4 | 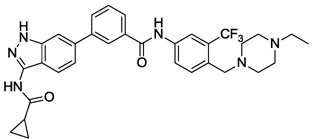 |
0.005 | 0.017 | 0.198 | >10 |
| 10 | 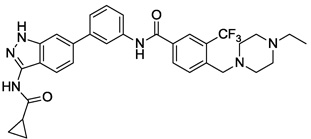 |
0.005 | 0.031 | 1.424 | >10 |
| 11 | 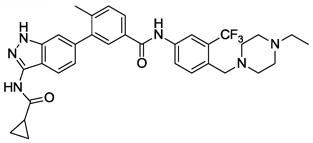 |
0.002 | 0.001 | 0.177 | 3.1 |
| 12 | 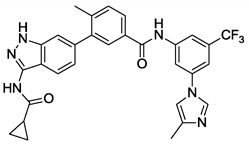 |
0.559 | 0.078 | 2.908 | >10 |
| 13 | 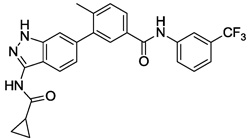 |
3.426 | 1.817 | 1.22 | >10 |
| 14 | 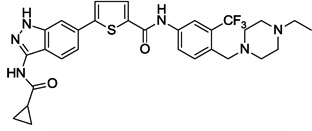 |
0.035 | 0.927 | 1.094 | 2.0 |
| 15 | 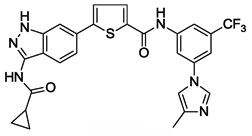 |
<0.001 | 0.13 | -b | 0.12 |
| 16 | 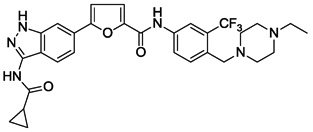 |
0.033 | 0.845 | 5.366 | 5.3 |
| 17 | 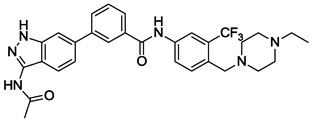 |
0.004 | 0.017 | 3.169 | >10 |
| 18 |  |
<0.001 | 0.001 | 1.528 | >10 |
| 22 |  |
0.002 | 0.001 | 0.727 | 4.4 |
Cellular antiproliferative activity (EC50, µM) on MOLM13, mutant PDGFRα–T674M–Ba/F3, mutant Kit–T670I–Ba/F3 and wt-Ba/F3, values are means of two experiments.
Nonsensical value.
