
Figure 4.
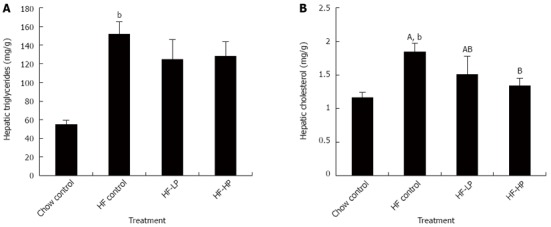
Effects of probiotic treatment on hepatic triglyceride and hepatic total cholesterol in high-fructose diet-fed rats. Results are expressed as mean ± SE. bP < 0.01 HF control vs chow control by unpaired Student’s t-test; ABBars with different capital letters are significantly different at P < 0.05 by Duncan’s multiple range tests. HF: High fructose diet; LP: Low dose probiotic; HP: High dose probiotic.