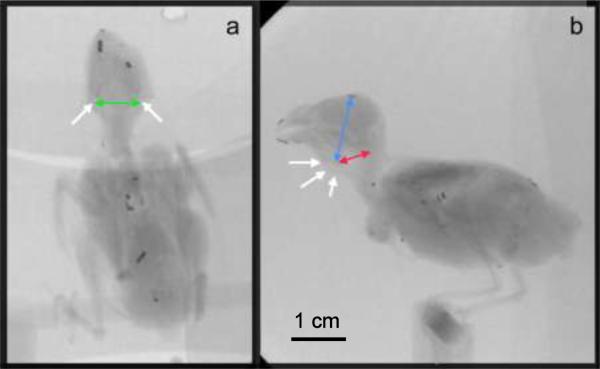
Figure 1.
Dorso-ventral (a) and latero-lateral (b) x-ray images of a zebra finch with superimposed arrows to indicate the measurements taken for quantifying OEC movement. Green arrow, distance between cornuae; red arrow indicates distance between the larynx (basihyoid) and the mid-point of the second vertebra, LV; blue arrow indicates distance between the larynx and the dorsal edge of the beak-skull transition, LH; white arrows in a point to the most ventral point of the left and right cornua of the hyoid apparatus, and to the larynx in b. Metal markers were attached to the tips of upper and lower beak, which allowed the automated tracing of beak movements. The images show a number of additional metal markers used for a different study.

