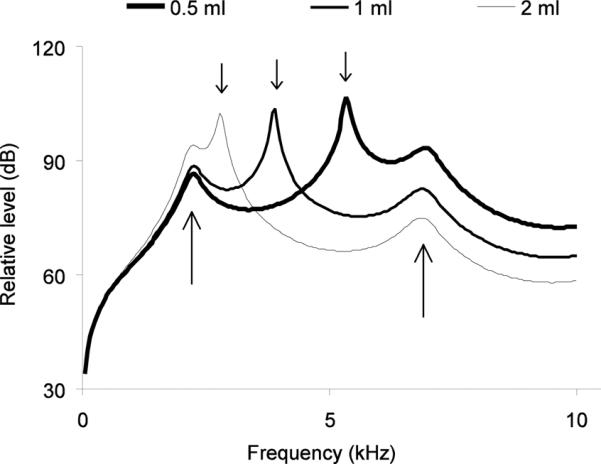
Figure 11.

Relative radiated power level as a function of frequency, for a constant input volume flow at the syrinx, with a OEC volume of 0.5, 1 or 2 ml and constant values for beak gap. The location of the variable OEC resonance peak depends on OEC volume (small black arrows on top). In the range up to 10 kHz, there are two tracheal resonances near 2.5 kHz and 7 kHz (indicated by two long arrows). Fletcher et al. (2006) suggested that if the tracheal resonance and the OEC resonance coincide, there will be a summation effect. OEC size in zebra finches measured by injecting cadavers with dental cast reaches a maximum of about 1.5 ml. This volume suggests an OEC resonance around 5 kHz, which is comparable with the first resonance peak in distance calls (Fig. 8).
