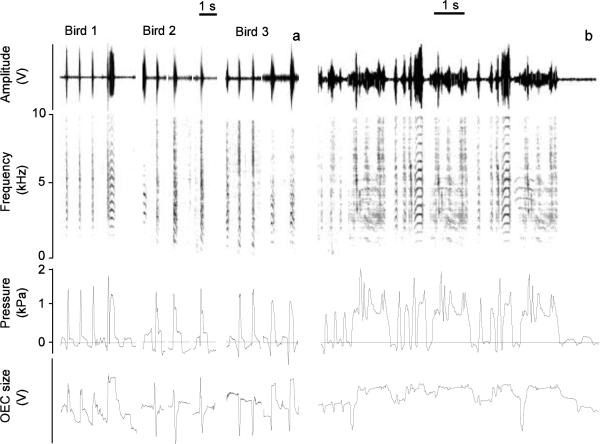
Figure 4.
The collar system can trace increases of the OEC during call (a) and song (b) production. Sound is depicted as time waveform (top panel, Amplitude, relative change in output voltage of microphone signal) and spectrographically (second panel). Subsyringeal air sac pressure (panel 3; horizontal line indicates ambient pressure) and OEC signals (panel 4; relative change in output voltage of Hall effect transducer) indicate that different call types are accompanied by different OEC signals. For example, birds 1 and 3 start with three short calls, followed by one and two, respectively, distance calls.

