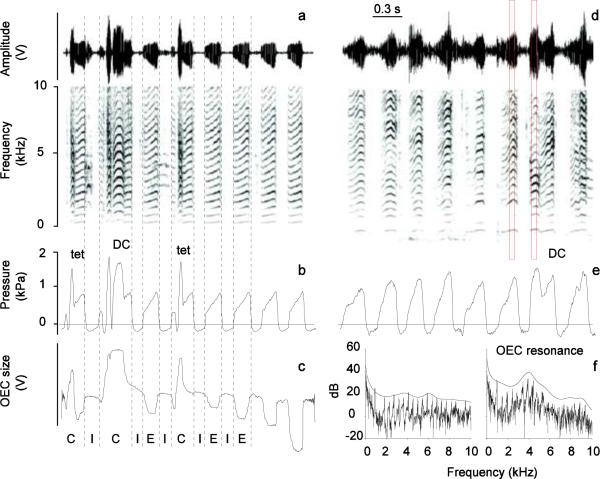
Figure 6.
Spectrograms of distance calls (DC) and short calls (tet) embedded in a series of respiratory sounds contrast the resonance pattern of the two sound types. Time waveform and spectrogram of the microphone signal (a and d), subsyringeal air sac pressure (b and e) and OEC size measured with the Hall effect collar system (c) of respiratory sounds and calls from male zebra finch 7 (a,b,c) and 9 (d,e). The Hall effect sensor signal shows that the OEC size is the largest during call production, it is enlarged during inspiration and smallest during expiration/respiratory sound production. f: Power spectra of two 50 ms segments (left: respiratory sound; right: DC; red boxes in d) overlaid by a smoothed envelope curve, indicating the OEC resonance peak. I, inspiratory phase; E, expiratory phase; C, call; units as in figure 4.

