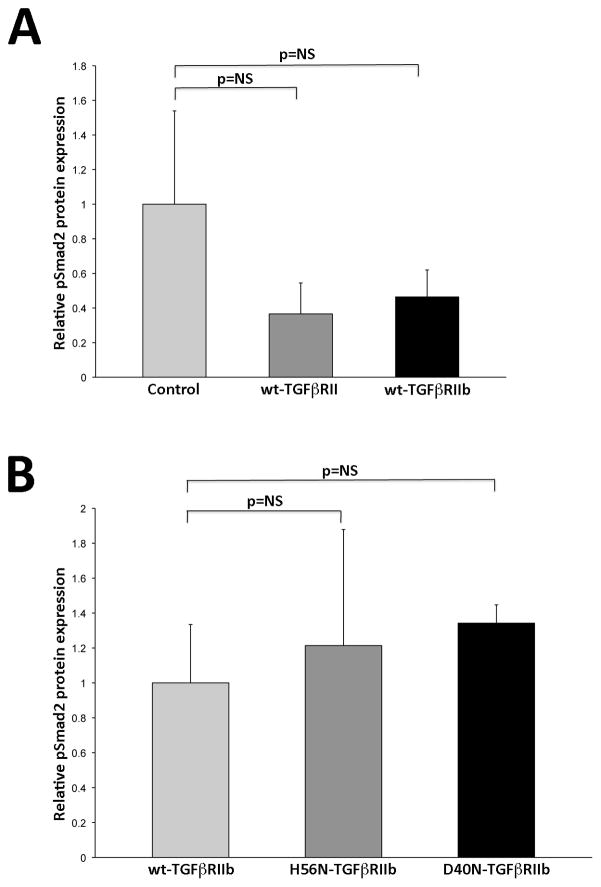
Figure 6.
In vitro TGFβ1-stimulation does not alter TGFβRII and TGFβRIIb activity. A. Relative quantification of pSmad2 expression after in vitro TGFβ1 stimulation. Bar graph displays densitometric quantification of pSmad2 protein expression relative to b-actin in untransfected control, wt-TGFβRII and wt-TGFβRIIb L6 cells (n=3). No significant change in TGFβRII or TGFβRIIb activity compared to control cells. B. Relative quantification of pSmad2 expression after in vitro TGFβ1 stimulation. Bar graph displays densitometric quantification of pSmad2 relative to b-actin in control wt-TGFβRIIb, H56N-TGFβRIIb and D40N-TGFβRIIb L6 cells (n=3). No significant change in activity in mutant TGFβRIIb cells compared to wt-TGFβRIIb cells in response to 0.5 hour 50 pM TGFβ1 stimulation. Values normalized to control L6 cells. All data presented as mean±SEM. P values shown. NS= not significant.

