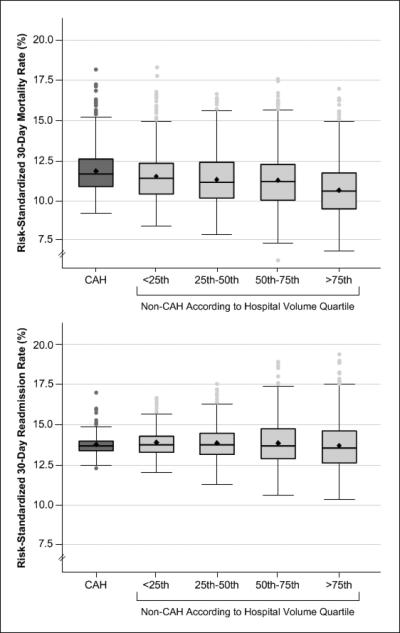
Figure 3. Distribution of 30-Day All-Cause Risk-Standardized Mortality Rates and Readmission Rates by Critical Access Hospital Status and Hospital Volume Quartiles.

Box and whisker plots of RSMR and RSRR by CAH and non-CAH status. The upper boundaries of the boxes represent the seventy-fifth percentile, the lines bisecting the boxes represent the median or fiftieth percentile, and the lower boundaries of the boxes represent the twenty-fifth percentile. The lower and upper boundaries of the whiskers are set at the fifth and ninety-fifth percentiles, with dots representing hospitals beyond these percentiles. Mean (standard deviation [SD]) RSMR values for CAHs and non-CAHs in order of increasing quartile are 11.9 (1.4), 11.5 (1.5), 11.3 (1.7), 11.2 (1.7), and 10.6 (1.6). Mean (SD) RSRR values are 13.7 (0.6), 13.8 (0.8), 13.8 (1.0), 13.8 (1.4), and 13.7 (1.6). Abbreviations: RSMR, risk-standardized mortality rate; RSRR, risk-standardized readmission rate; CAH, Critical Access Hospital.
