
Fig. 1.
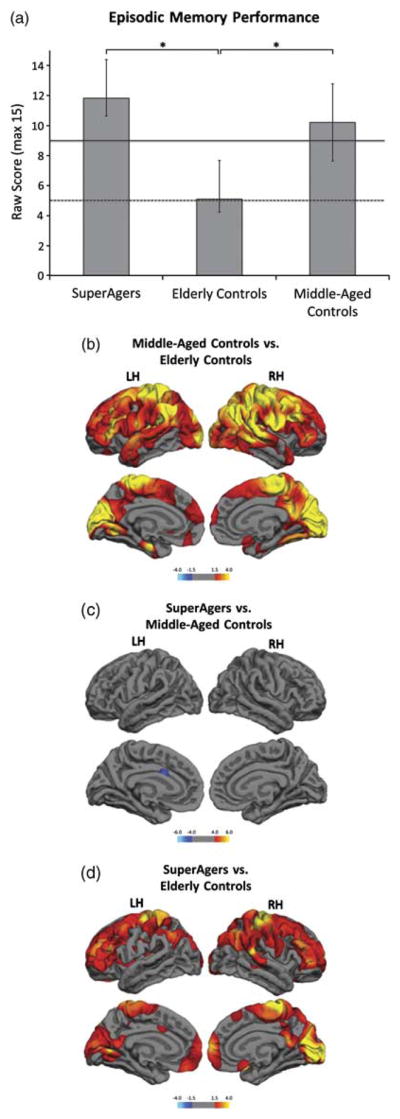
Episodic memory performance and differences in cortical thickness by group. (a) Group average delayed recall scores on the RAVLT word list show SuperAgers performing significantly better than elderly controls. There is no significant difference in episodic memory performance between SuperAgers and middle-aged controls. The solid and dotted lines represent the average normative values for a 60-year-old and an 80-year-old, respectively (Schmidt, 2004). * represents significant differences at p <.05. (b) Red and yellow represent significantly thinner cortex in elderly controls compared to middle-aged controls. (c) There is no significant thinning in the SuperAging group in either hemisphere compared to middle-aged controls. A region within the anterior cingulate (blue) is significantly thicker in SuperAgers when compared to middle-aged controls. (d) Red and yellow represent significantly thinner cortex in elderly controls compared to SuperAgers. False discovery rate (FDR) was set at 0.05 for each MRI analysis. Color bars display significance using as −log(10) p value.