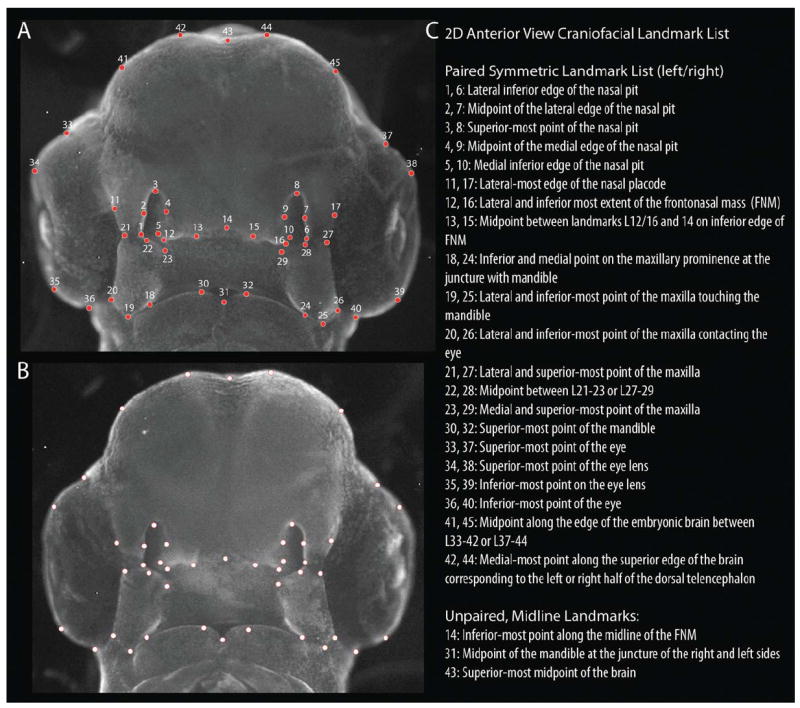
Fig. 9.

Location of landmarks used in the geometric morphometric analyses. A: Landmarks shown on a representative normal embryo. B: Landmarks shown on alternative embryo without numbers and enhanced transparency to better show associated representative anatomy. C: Descriptive list of landmarks. [Color figure can be viewed in the online issue, which is available at wileyonlinelibrary.com.]
