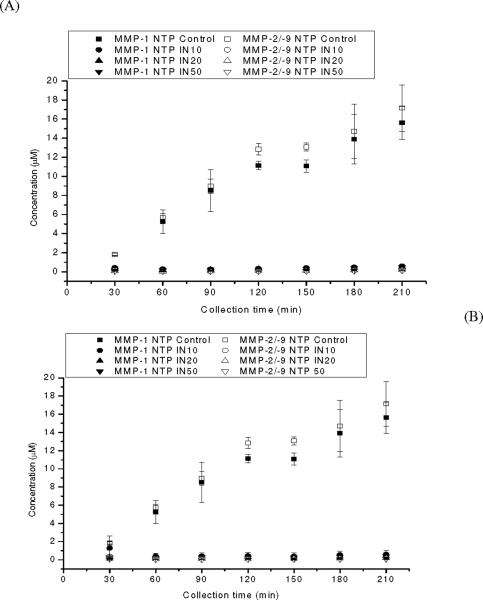
Figure 3. Time-dependent MMP-1 NTP and MMP-2/-9 NTP formation.
(A) Microdialysis with inhibitor included in the sample medium with activated MMPs, and (B) microdialysis with inhibitor included in the perfusate with substrates. Control denotes MMP-1 substrate (50 μM) and MMP-2/-9 substrate (50 M) being perfused to the sample medium containing activated MMP-1 and MMP-9, with no inhibitor present. IN10, IN20, IN50 denotes inhibitor concentration of 10, 20, 50 μM present in the sample medium or perfusate. Data represent mean±S.D., n=4.

