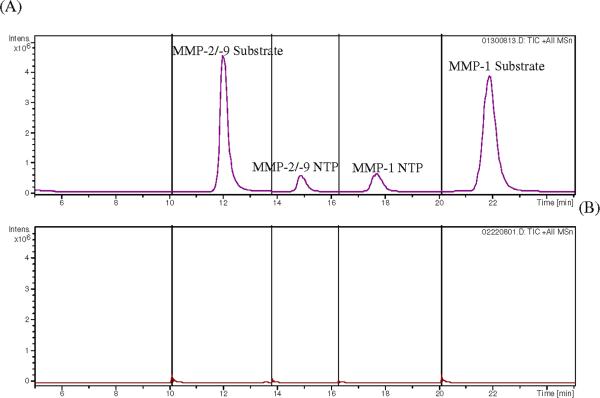
Figure 4. LC/MS/MS chromatograms of in vivo dialysates.
(A) Dialysate with substrate perfusion, and (B) PBS blank sample. Peaks were labeled with corresponding analyte. Full scan product ion spectra of the [M+H]+ ions were monitored in different segments including MS/MS of m/z 1012 for MMP-2/-9 substrate (10 to 13.8 min), MS/MS of m/z 452 for MMP-2/-9 NTP (13.8 to 16.3 min), MS/MS of m/z 466 for MMP-1 NTP (16.3 to 20 min), and MS/MS of m/z 992 for MMP-1 substrate (20 to 25 min).

