
Figure 3.
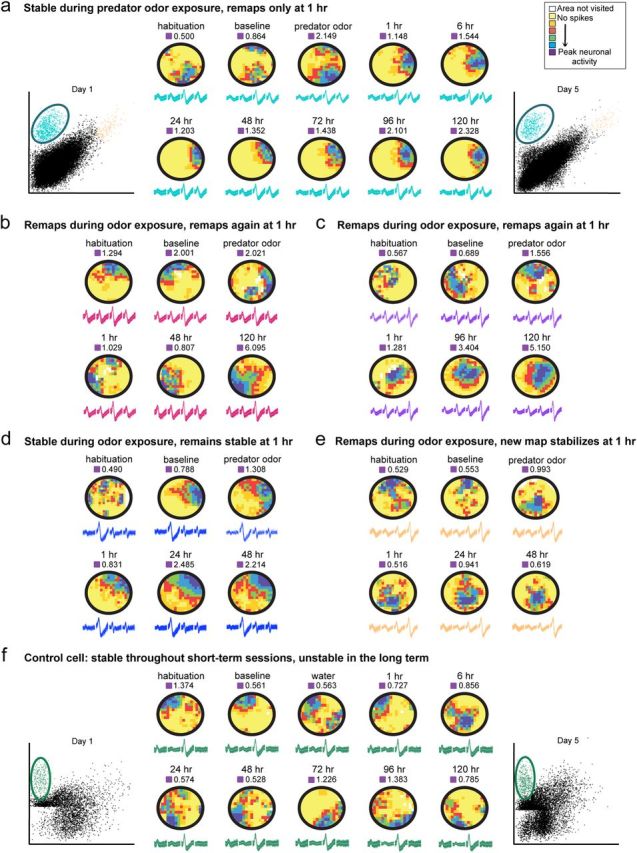
a–e, Examples of rate maps generated from cells recorded in fear-conditioned animals. In these maps, yellow indicates areas visited by the animal where the place cell does not fire, whereas increasingly vivid colors indicate higher firing frequencies. Cells exhibited heterogeneous responses during and shortly after fear conditioning: some were stable during predator odor exposure but remapped at 1 h (a), some remapped during coyote odor exposure and again at 1 h (b, c), some remained stable throughout (d), and some remapped in coyote but stabilized the new coyote map at 1 h (e). In all examples, cells became stable in the long term and the map that stabilizes is similar to the one formed directly after coyote odor exposure (1 h session). The blue cluster is the example cell shown in a. f, Example of a rate map generated from a cell recorded in a control animal exposed to water. This place field is stable in the short term (baseline, water, and 1 h sessions) but unstable in the long term (24 h through 120 h). The green cluster is the example cell shown in e. Waveform and cluster constancy indicate stability in the recordings. Peak firing frequency for each session is indicated above each rate map.