
Figure 4.
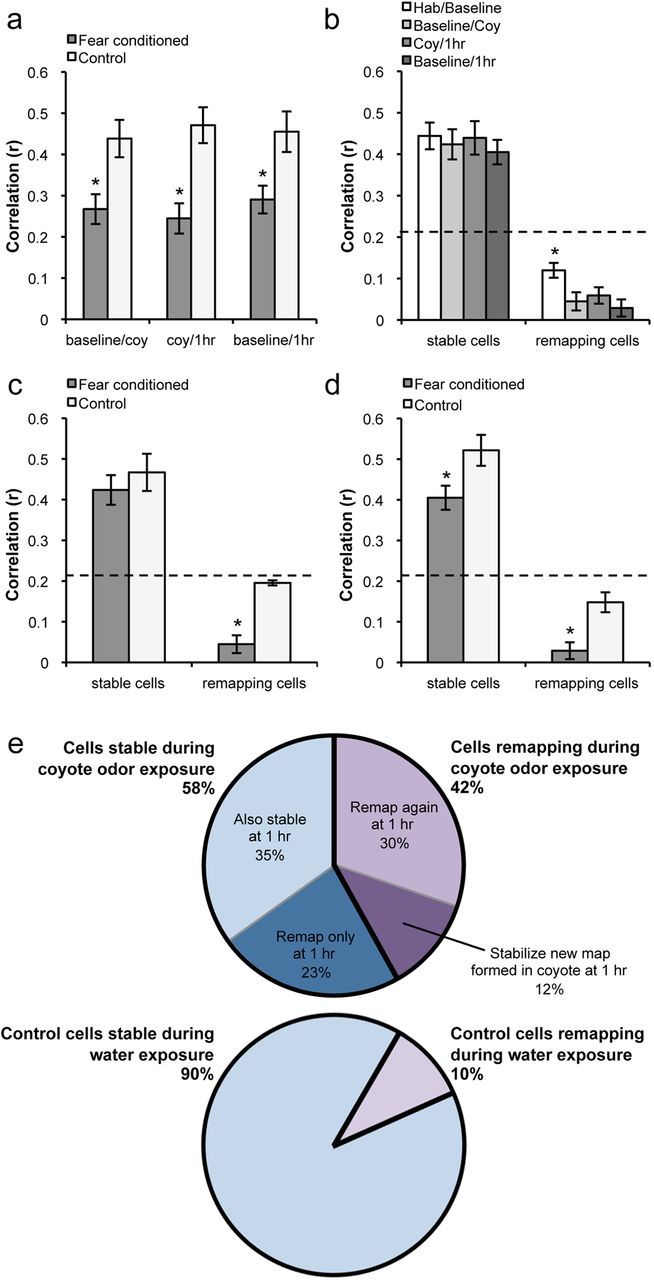
a, Comparison of average correlations between groups during short-term sessions. The fear-conditioned group shows significantly lower short-term correlations due to remapping in a subset of cells. b, Within fear-conditioned animals, short-term remapping induced by fear was more robust than long-term remapping between habituation and baseline. c, d, Between-group comparisons of stable and remapping cells between baseline and coyote odor exposure (c) and baseline and 1 h (d). Unstable cells in the fear-conditioned group remapped significantly more than the few unstable cells in the control group in both sessions. Furthermore, stable cells were also significantly less stable in the fear-conditioned group when comparing the baseline and 1 h sessions (d). e, Top, Pie chart showing percentage of stable (58%) and remapping (42%) cells during coyote odor exposure. Within these two groups, cells are further subdivided into their responses 1 h after conditioning. Bottom, Pie chart showing percentage of stable (90%) and remapping (10%) cells during the conditioning session of the control group. There are no further subdivisions of cells in the control group because no remapping is observed between the conditioning session and the 1 h session. The dotted lines indicate stability threshold (r = 0.21). Means ± SEM are shown. *p < 0.05.