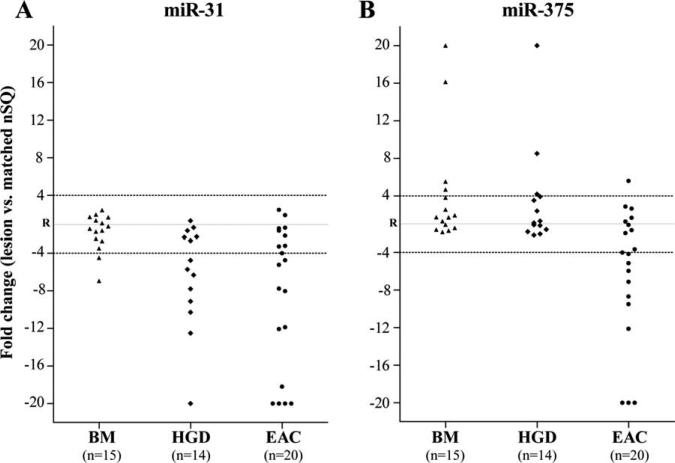
Figure 1.
Alterations in miR-31 and –375 expression levels in Barrett's carcinogenesis. MiRNA expression levels in each of the BM, HGD, and EAC lesions were shown as linear fold changes relative to respective paired nSQ tissues. The solid gray reference line in the middle of the Y-axis, represented by the letter “R,” corresponds to a miRNA expression ratio value of 1.0 between lesion and paired nSQ tissues, thus indicating no change. The horizontal dotted lines at +4 and –4 correspond to a 4-fold up- and downregulation in miRNA expression levels between lesion and paired nSQ tissues, respectively. For simplicity, lesions with greater than 20-fold up- and downregulation in miRNA expression were plotted on the Y-axis at 20 and –20, respectively. miRNA expression levels in BM and HGD cases were determined using qPCR. For EACs, data derived from the NGS discovery set (n = 9), and qPCR validation cohort (n = 11) were combined in the figure. Both miR-103 and –191 were used as endogenous controls for normalizing miRNA expression levels in each of the samples in NGS and qPCR assays (described in Supporting Information Methods section).

