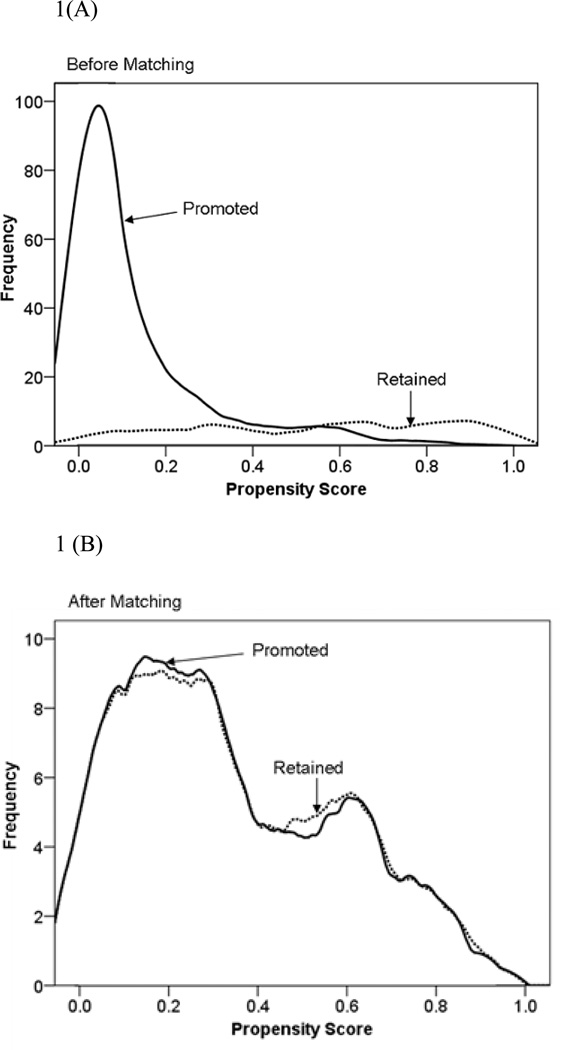
Figure 1.
Kernel density plots of the frequency distributions of the propensity score for promoted and retained children. Panel (A) depicts the distributions for the promoted (n = 603) and retained (n = 165) in the full sample. Panel (B) depicts the distributions for one target child and one matched child (randomly selected if there was more than one match) for each of the matched sets (n = 80 in each group). In all, there were n = 251 promoted children and n = 124 retained children after 1:many matching. The scale of the Y-axes differs between the two panels. Source: Wu, W., West, S. G., & Hughes, J. N. (2010). Effect of grade retention in first grade on psychosocial outcomes. Journal of Educational Psychology, 102, p. 142.

