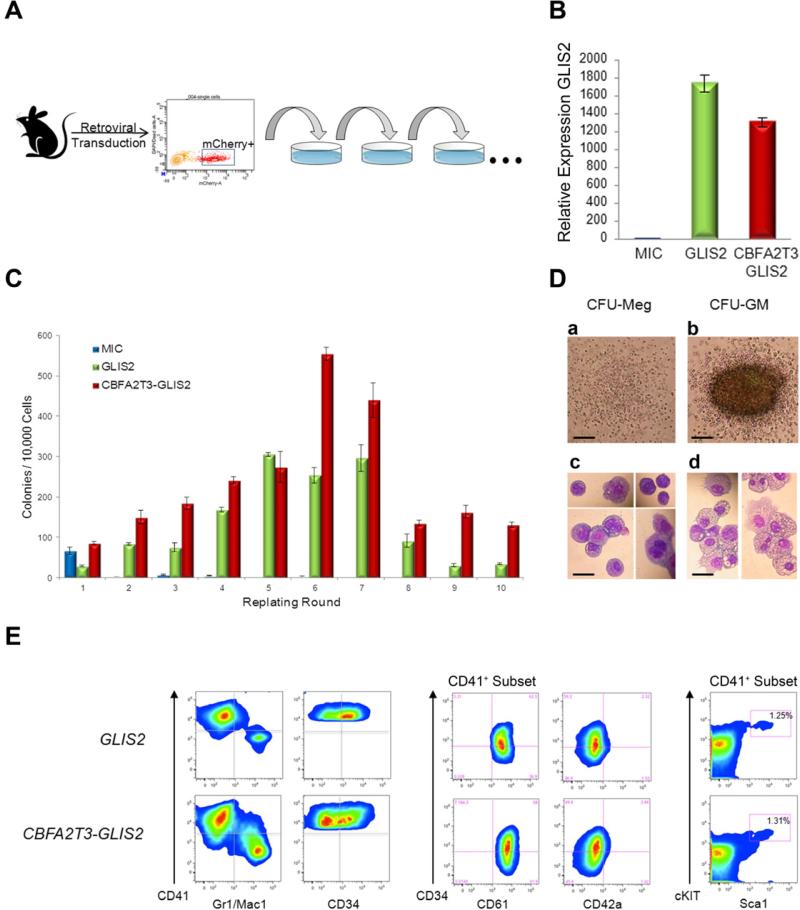
Figure 5. CBFA2T3-GLIS2 leads to enhanced replating of hematopoietic cells.
(A) Experimental design. Murine bone marrow cells were transduced with retroviral vectors expressing mCherry alone (MSCV-IRES-mCherry, “MIC”), or mCherry along with GLIS2, or CBFA2T3-GLIS2. Transduced cells were purified by sorting mCherry positive cells and plated onto methylcellulose containing IL3, IL6, SCF, and EPO. Colonies were counted after 7 days of growth and replated serially. (B) Semi-quantitative RT-PCR of GLIS2 utilizing cells harvested from first round of plating. GLIS2 primers are specific for the 3’ half of the transcript and thus pick up both full length GLIS2 as well as CBFA2T3-GLIS2. Expression in MIC cells was defined as 1, and data is pooled from two separate experiments with similar results. p=<0.0001 as determined by one-way ANOVA. Error bars represent mean ± SEM of two independent experiments. (C) Number of colonies detected at 7 days following each plating. Error bars represent mean ± SEM of two independent experiments. (D) Colony morphology detected in GLIS2 and CBFA2T3-GLIS2 modified cells from the 2nd plating and beyond. a, CFU-Meg; b, CFU-GM. Scale bars, 500 m. Representative cytospins and morphology of each colony type are shown. c, CFU-Meg; d, CFU-GM. Scale bars, 50 m. (E) Cells harvested from colony forming assays after 3 or more replatings were subjected to flow cytometry. Cells were negative for acetylcholinesterase (data not shown).

