
Figure 1.
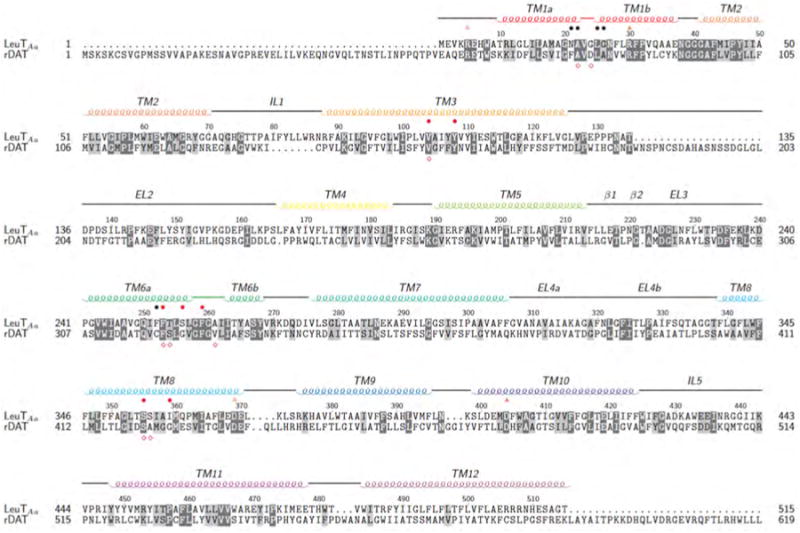
Conserved residues are highlighted in dark grey while similar residues are highlighted in light grey. Above the sequences, orange open triangles indicate the intracellular gates and orange filled triangles indicate the extracellular gates. Residues comprising the primary substrate site (S1) of LeuTAa are marked with black bullets while red bullets indicate interacting residues of the S1 site of LeuTAa.12 Below the sequence, red diamonds indicate residues involved in dopamine binding of DAT.15