
Figure 3.
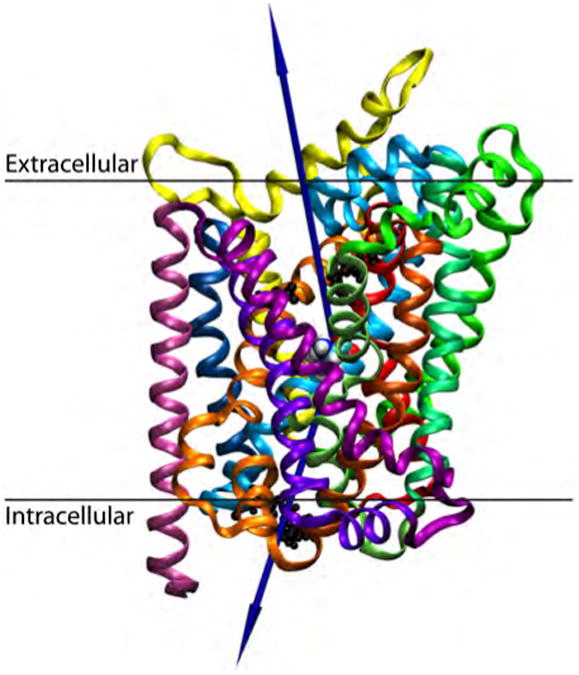
A graphic representation of the LeuTAa:Leu complex for MCTI simulations. The substrate, leucine is shown in the primary pocket in VDW spheres. Intracellular (1R5/8D369) and extracellular (1R30/10D404) salt bridges are highlighted in a black CPK representation. The proposed permeation pathway from the pocket to each milieu is shown with a blue vector. The 12 transmembrane helices are colored as ribbons: TM1, red; TM2, dark orange; TM3, light orange; TM4, yellow; TM5, lime-green; TM6, sea-foam green; TM7, green-cyan; TM8, cyan; TM9, navy-blue; TM10,violet; TM11, purple; TM12, mauve. This coloring scheme for TM helices will be used throughout the figures, unless otherwise noted.