
Figure 4.
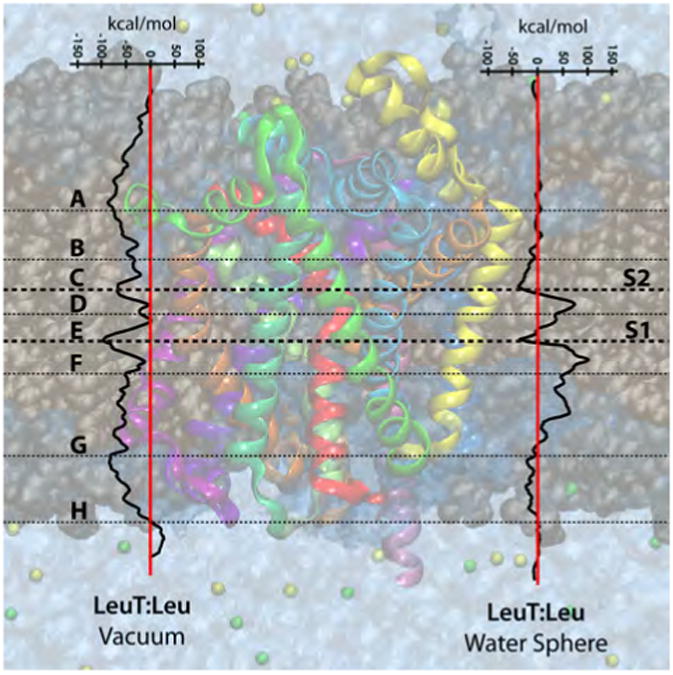
Free energies profiles of the substrate leucine through LeuTAa, as calculated via the MCTI method in both environments (vacuum and water sphere). Identified stopover sites (points of interest) are labeled A-H with horizontal lines depicting their general position in their respective transporter.