
Figure 5.
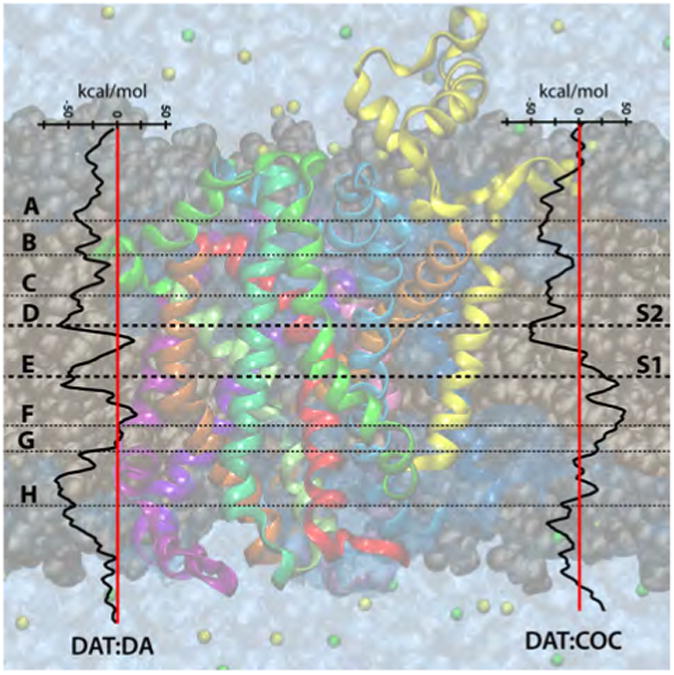
Free energies profiles of the substrate dopamine and inhibitor cocaine in DAT, as calculated via the MCTI method in vacuum. Identified stopover sites (points of interest) are labeled A-H with horizontal lines depicting their general position in their respective transporter.