
Figure 9.
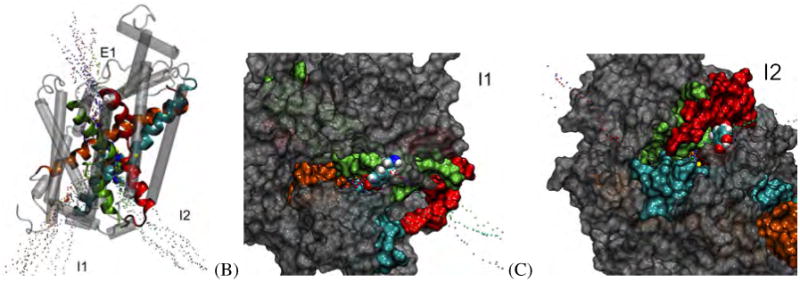
Pathways observed in the DAT:DA RAMD simulations. (A) Three pathways were observed for the DAT:DA complex: One primary extracellular pathway (R6E1), and two main intracellular pathways (R6I1 and R6I2). (B) Snapshot from a trajectory of an R6I1 egress. Dopamine (shown in VDW spheres) follows a pathway that closely follows TM 6b/8. (C) Snapshot from a trajectory of an R6I2 egress. Dopamine follows a pathway that closely follows TM 1a/6b. Pathways of R6I1 can be seen on the left-hand side of this image. In (A), TMs 1, 3, 6 and 8 are colored as red, light orange, sea-foam green and ribbons, respectively; while in (B) and (C) the TMs are colored the same but represented by surfaces with a 1.4 Å probe radius. The remainder of the TMs are shown are transparent grey tubes or surfaces, for clarity. Dopamine is represented by VDW spheres. In all panels, observed pathways are represented as isosurfaces; each color of pathway indicates a separate run.