
Figure 2. JO-1 allows for lowering of chemotherapeutic doses and mitigates toxic side effects.

A-D) Irinotecan: Immunodeficient CB17-SCID/beige mice were injected subcutaneously with 4×10⁶ A549 cells. JO-1 (2 mg/kg) was injected at day 14 intravenously (when tumors had a volume of 65 mm3) followed by an intraperitoneal injection of irinotecan (I) at two different dose levels (75 mg/kg or 37.5 mg/kg) or PBS 1 h later. The treatment was repeated weekly until day 36. A) Tumor volumes. n = 5. irinotecan (37.5 mg/kg) vs. JO-1+irinotexan (37.5 mg/kg): P<0.01 on day 38; P<0.001 day 38 for 75 mg/kg. B–D) At the end of the monitoring period animals were sacrificed and blood cell counts as well as tissue histology were analyzed. I(37.5) – irinotecan (37.5 mg/kg), I(75) – irinotecan (75 mg/kg). B) Platelet and white blood cell counts in treated mice at the day of sacrifice (day 38). n=5, irinotecan (37.5 mg/kg) vs. JO-1+irinotexan (37.5 mg/kg): **P<0.01. irinotecan (75 mg/kg) vs. JO-1+irinotexan (75 mg/kg): ***P<0.001. C) Representative spleen sections, H&E stained. Note depletion of cells in germinal centers in I(75) treated mice. Magnification: 20x. D) Representative intestine sections.
E–G) nab-paclitaxel (ABX): Immunodeficient CB17-SCID/beige mice were subcutaneously injected with 3×10⁶ MDA-MB-231 cells. Mice were treated from day 23 on, when the tumors reached a volume of ~ 90 mm3. They were injected every other day with JO-1 (2 mg/kg) or PBS intravenously, followed 1h later by nab-paclitaxel (ABX) at different dose levels (10 and 5 mg/kg). E) Tumor volumes. n = 5. ABX (5 mg/kg) vs JO-1 + ABX (5 mg/kg): P<0.001 from day 28 on; ABX (10 mg/kg) vs. JO-1 + ABX (10 mg/kg): P<0.01 from Day 30 on. F) White blood cell counts in treated mice at the day of sacrifice (day 36). n=5, ABX(10) vs JO-1+ABX(10): *p<0.05. G) Representative sternum sections. H&E stained. Note depletion of bone marrow cells in ABX(10) treated mice.
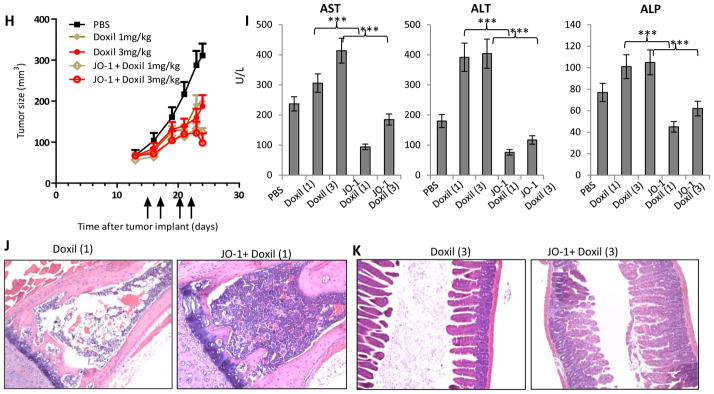
H-K) liposomal doxorubicin (Doxil). A total of 4×10⁶ A549 cells were injected subcutaneously into CB17-SCID/beige mice. Once the tumor reached a volume of 65 mm3, the mice were injected intravenously with 2 mg/kg JO-1 or PBS, followed by an intravenous injection of liposomal doxorubicin (1 or 3 mg/kg) or PBS one hour later. The treatment was repeated on day 17, 20 and 22. H) Tumor volumes. n = 5. Liposomal doxorubicin (1 mg/kg) intravenously vs. JO-1 + Liposomal doxorubicin (1 mg/kg): P < 0.05 from day 23 on; Liposomal doxorubicin (3 mg/kg) vs. JO-1 + Liposomal doxorubicin (3 mg/kg): P < 0.05 from day 24 on. I–K) Toxicology studies Doxil (1) – liposomal doxorubicin (1 mg/kg), Doxil (3) – liposomal doxorubicin (3 mg/kg). I) serum enzymes: aspartate aminotransferase (AST), alanine aminotransferase (ALT) and alkaline phosphatase (ALP). n=3. Liposomal doxorubicin (1 mg/kg) vs JO-1+Liposomal doxorubicin (1 mg/kg): **P<0.01; Liposomal doxorubicin (3 mg/kg) vs JO-1+Liposomal doxorubicin (3 mg/kg): **P<0.01. The elevated transaminase levels in PBS- treated control animals could be explained by the presence of relatively large xenograft tumors in these mice which potentially can produce factors that act on hepatocytes. J) Representative sternum sections. K) Representative intestine sections.