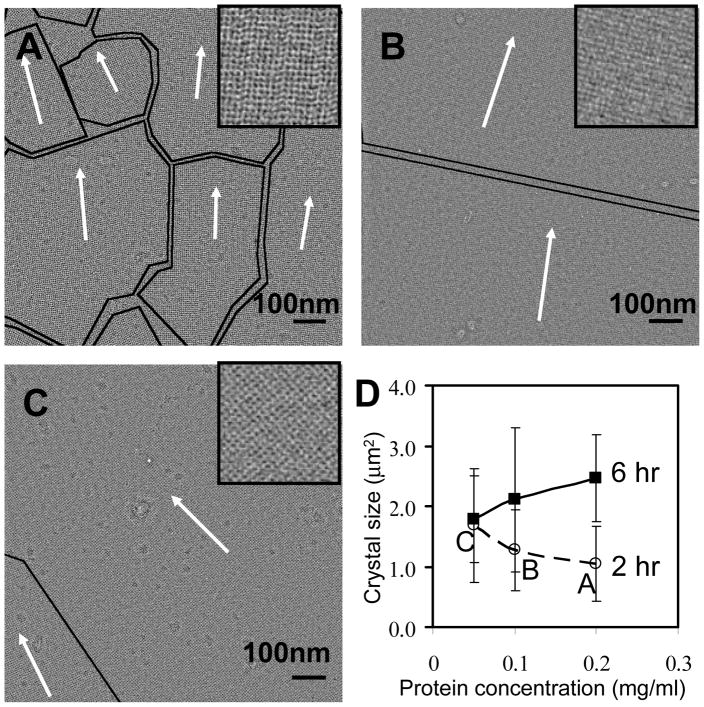
Fig. 4.
Protein concentration and crystal growth time effects on the crystal size. EM images show the negatively stained crystal grown from (A) 0.2 mg/ml (B) 0.1 mg/ml (C) 0.05 mg/ml of streptavidin solutions for 2 hours at room temperature. The black curves outline the domain boundaries, the arrow shows the crystal orientation in each region, and each inset is a 3× closeup of the adjacent region. (D) The dependence of average single crystal size on the protein concentration and growth time. The crystal growth time was varied from 2 hr (dashed line) to 6 hr (solid line) and overnight (data not shown, but the crystal covered entire 2 μm-diameter holes for 0.2 mg/ml of protein concentration). The error bar is the standard deviation of crystal sizes.

