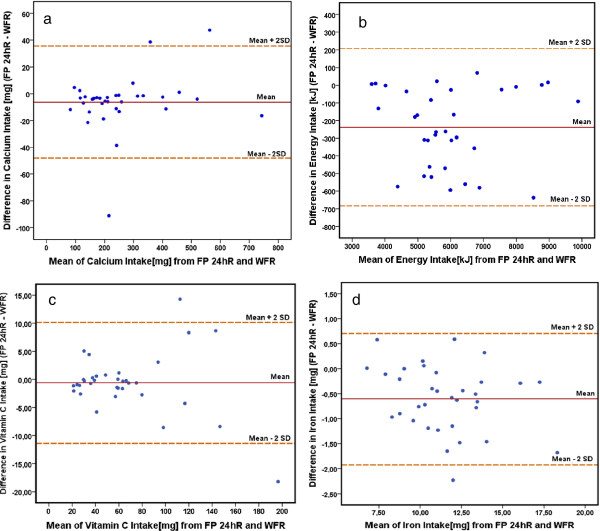
Figure 6.
Bland Altman plots for nutrient intakes calculated from FP 24-hR and WFR. Differences between the mean dietary intakes of nutrients calculated from FP 24-hR and WFR against their mean values. The solid line represents the average difference between the FP 24-hR and WFR; the dotted lines show the 95% limits of agreement for the differences. a) Plot for energy intake, b) Plot for calcium intake, c) Plot for vitamin C intake and d) Plot for iron intake. The ranges of proportional agreement are narrow enough to be confident using the photo method.

