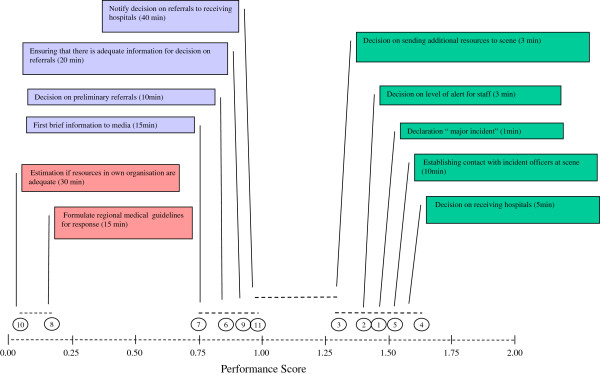
Figure 5.

Comparison of scores from 11 different performance indicators in 66 MI (Table 2). The mean values of the 11 indicators are on the baseline. The numbers of each performance indicator are circled (Table 2). Numbers that lie below the same horizontal line are not significantly different from each other. For example: Scores from Indicators 8 and 10 differ significantly from the rest of the indicators (1, 2, 3, 4, 5, 6, 7, 9, and 11).
