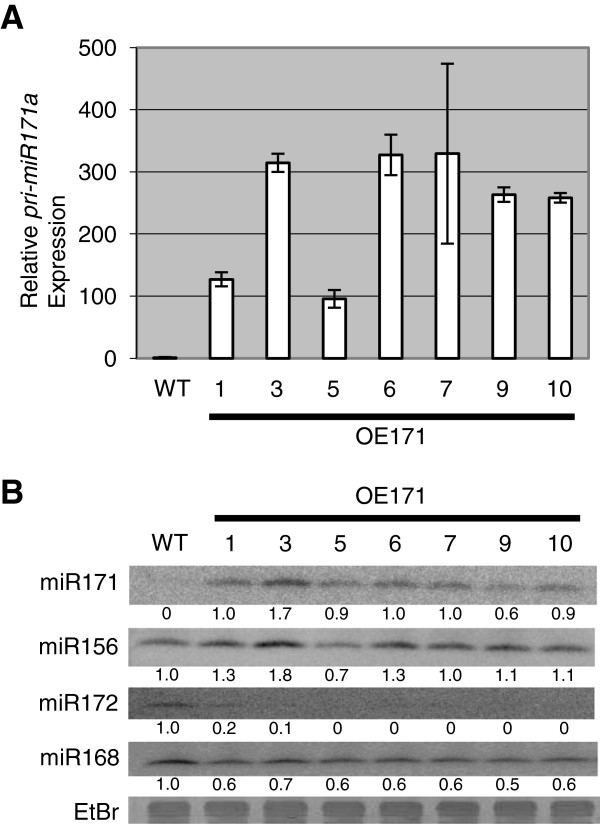
Figure 2.
Expression of pri-miR171a and miR171 in OE171 transgenic lines. (A) RT-qPCR showing the abundance of pri-miR171a mRNA in T0 leaves of OE171 lines (numbered) relative to WT (set as 1.0). (B) Northern blot showing the level of different mature miRNA sequences in leaves of T0 OE171 lines and WT. miR168 was used as loading control.

