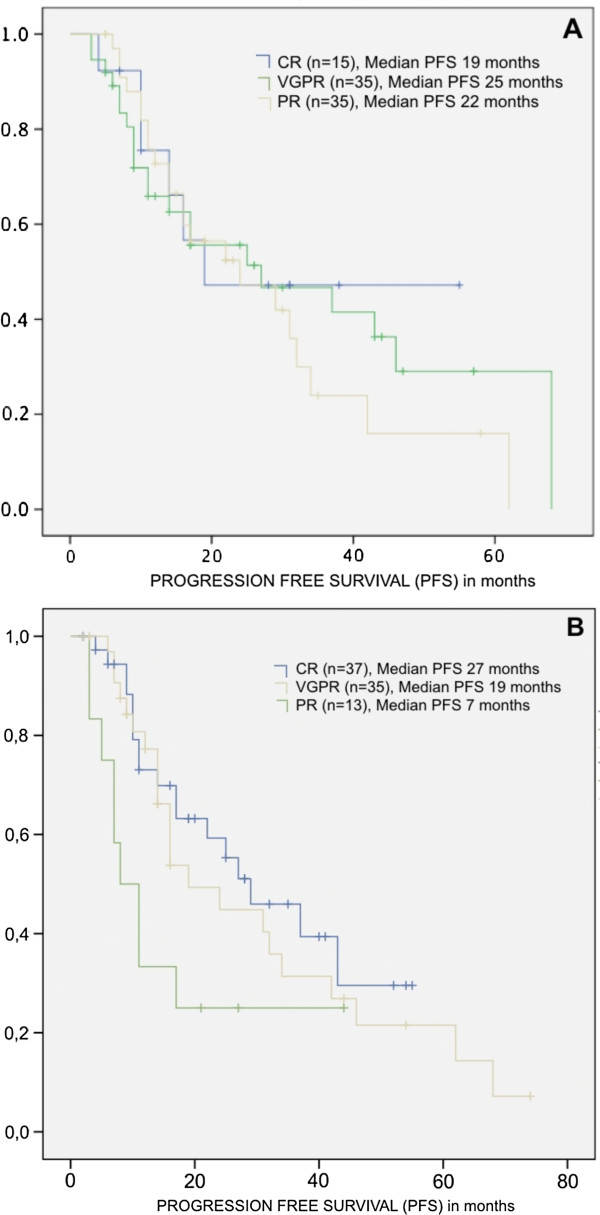
Figure 2.
Kaplan Meyer curves for Progression free survival from patients with Multiple Myeloma according to the response achieved after induction chemotherapy (A) – CR vs VGPR, p = 0.485; CR vs RP, p = 0.710; VGPR vs PR, p = 0.508) and after autologous stem cell transplant (B) - CR vs VGPR, p = 0.529; CR vs RP p = 0.034; VGPR vs RP, p = 0.049. (CR – complete response; VGPR – very good partial response; PR – partial response).

