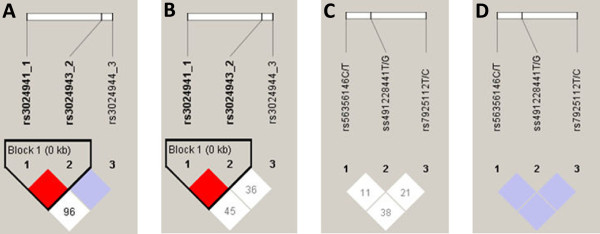
Figure 1.

Linkage disequilibrium of studied variants in asymptomatic and uncomplicated malaria. Linkage disequilibrium pattern of studied SNPs in promoter regions of STAT6 in uncomplicated malaria (A); STAT6 in asymptomatic children (B); IL10RA in uncomplicated malaria (C); and, IL10RA in asymptomatic children (D). At the top, the SNPs are shown according to their succession from the promoter region of studied gene. Empty squares indicate a high degree of LD (LD coefficient D’ = 1) between pairs of markers, numbers indicate the D’ value, red squares indicate strong LD, purple and white squares indicate lower degree of LD with LOD <2. The haplotype block is outlined by a solid line.
