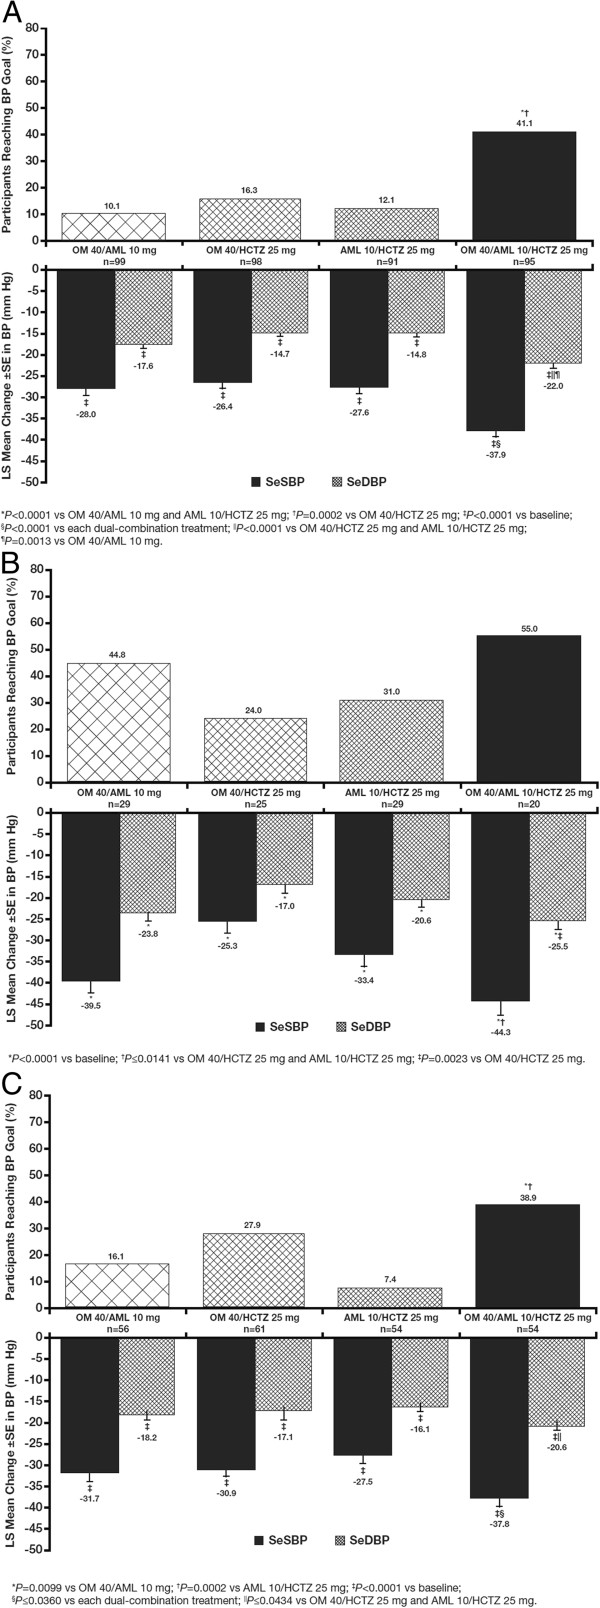
Figure 3.
Diabetes (A), CKD (B), and chronic CVD (C) subgroups: LS Mean (SE) reductions in SeBP and proportion of participants reaching BP goal (<130/80 mm Hg) at week 12 (LOCF). Specific P values are found beneath each panel. AML, amlodipine besylate; BP, blood pressure; CKD, chronic kidney disease; CVD, cardiovascular disease; HCTZ, hydrochlorothiazide; LOCF, last observation carried forward; LS, least squares; OM, olmesartan medoxomil; SE, standard error.

