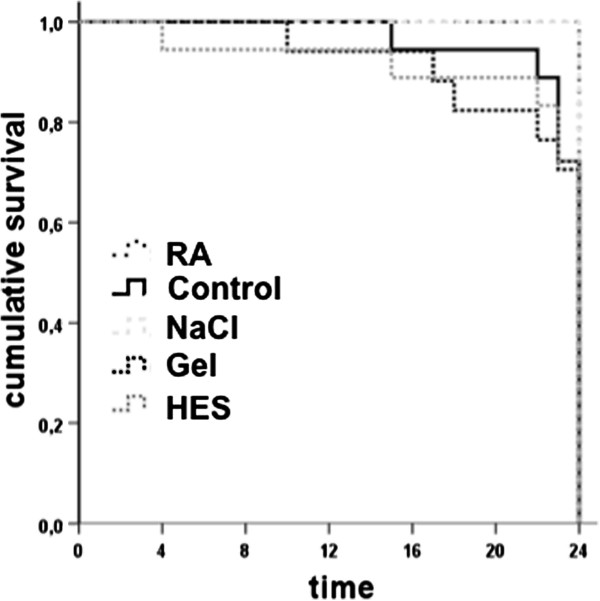
Figure 2.

Survival curves. Schematic presentation of the experimental trial. Sepsis was performed by coecum ligation and puncture (CLP). Central venous line (CVL) and continuous invasive arterial pressure line (Art.) were implanted and fluid administration was performed (group (Grp), body weight (BW)). Blood gas analyses (BGA) were measured 30 minutes after surgical procedures and after 24 h with cardiac output (CO) calculations. Afterwards data of the liver sinusoidal and intestinal blood flow were collected using intravital microscopy (IVM) and at the end of the experiment blood samples and organs (B&O) were harvested.
