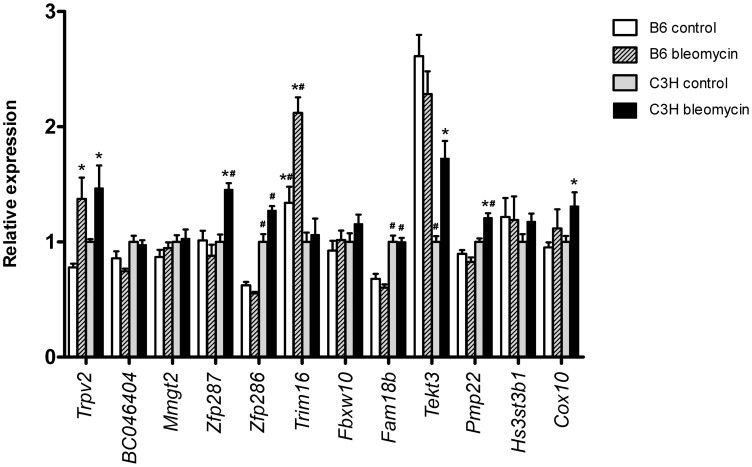
Figure 2. Pulmonary expression of reduced region Blmpf2 genes.
Real-time quantitative PCR of genes mapping to the reduced Blmpf2 region prior to (day 0: non-treated) and following bleomycin treatment (day 42) in the lungs of B6 and C3H mice. Gene expression was normalized to the Ataxin10 reference gene and is presented relative to the level in untreated C3H mice. Mean ±SEM of 5 per group. * indicates a significant difference in expression in lungs of bleomycin-treated mice relative to untreated controls, p<0.05; # indicates a significant difference in expression by strain, p<0.05.

