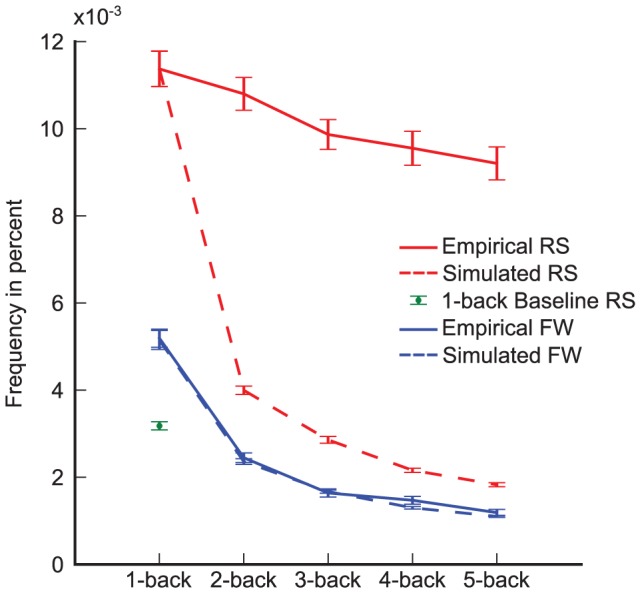
Figure 3. The frequency of return and forward saccades in empirical data and in simulation.

For the case of 1-back saccades, the number of empirically observed return saccades (‘Empirical RS’) is larger than expected by chance (‘1-back Baseline RS’) and larger compared to the number of forward saccades (‘Empirical FW’). The simulator reproduces the number of forward (‘Simulated FW’) and return saccades (‘Simulated RS’). In the case of 2-back saccades, we find more return saccades than expected from the statistics of 1-back saccades, while the number of forward saccades is identical to the number of simulated forward saccades. When analyzing the presence of 3- to 5-back saccades, a similar pattern holds. Errorbars are bootstrapped 95% confidence intervals.
