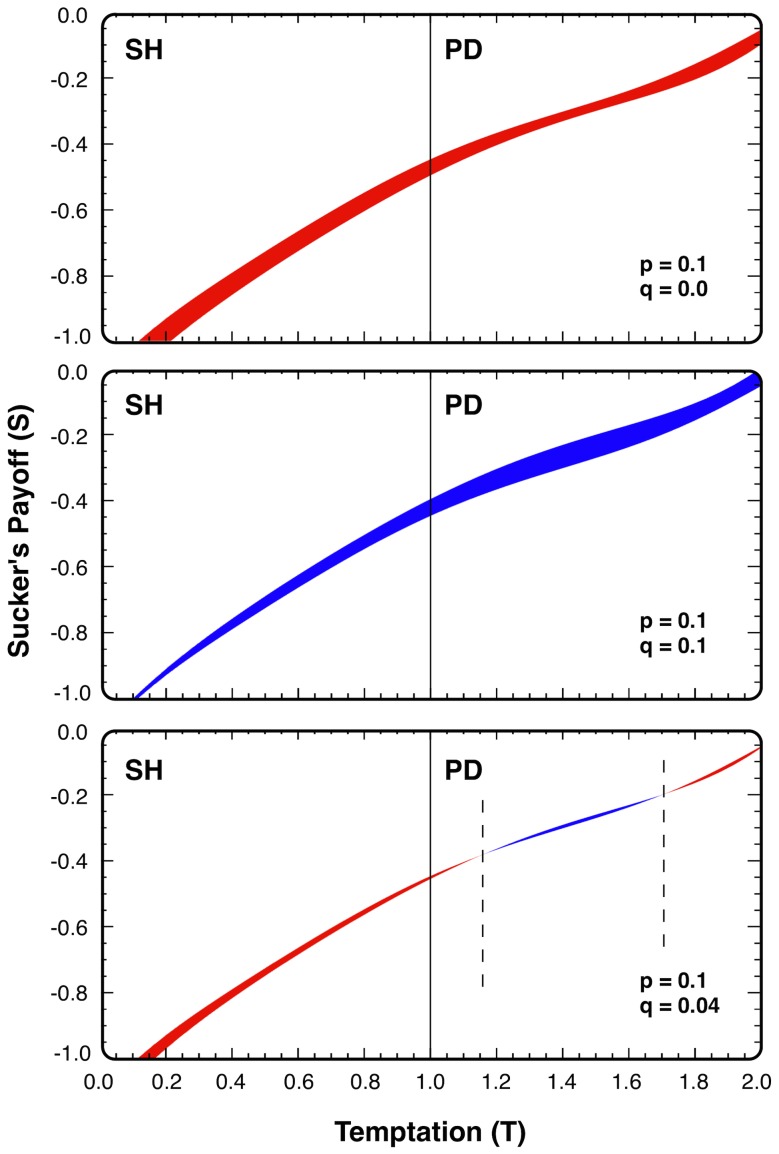
Figure 3. The effect of different p, q parameters on cooperation on the T - S plane.
Upper panel (q = 0, p = 0.1): the introduction of punishment made cooperation dominant for an additional region (red shaded area). Middle panel (q = 0.1, p = 0.1): the ‘unsuitable’ use of punishment made a big domain of the T - S plane inaccessible for cooperation (blue shaded area). Lower panel (q = 0.04, p = 0.1): the effects of punishment are ambiguous: there are (T, S) values for which punishment enhances the overall cooperation (red shaded area); however on other areas it hinders it (blue shaded area located between vertical dashed lines).

