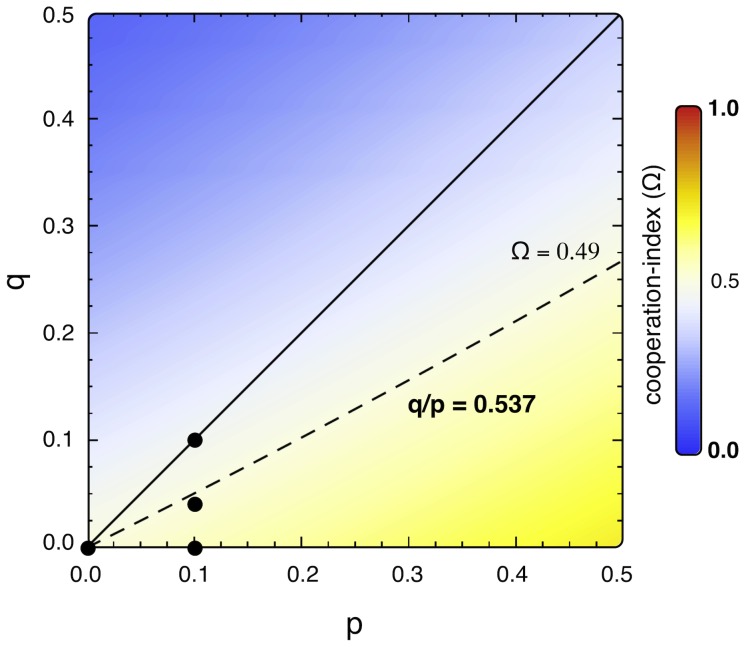
Figure 4. The overall impact on cooperation for different p, q parameters.
The dashed line indicates cost-over-punishment ratio values for which overall cooperation remains unaffected by altruistic punishment (Ω = 0.49). The area below (above) the dashed line comprises the parameter region with enhanced (inhibited) cooperation. Black solid circles identify the parameter values used in the plots in Figures 1 and 3. Altruistic punishment (p>q) occurs below the solid line.

