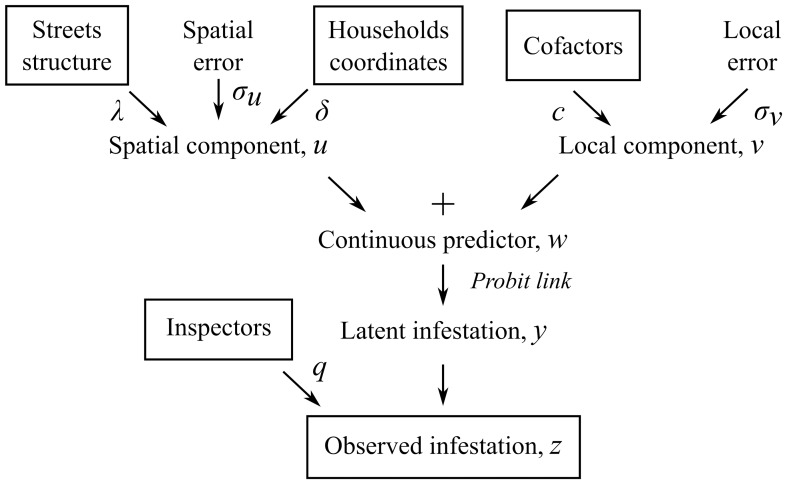
Figure 1. General structure of the Gaussian Field Latent Class model.
Working backward, we consider the infestation data  to be the result of a latent infestation status
  , observed by imperfect inspectors of sensitivity
  . The true infestation
  is a binary manifestation of an underlying continuous infestation predictor
  . Cofactors and a local error term,
  , form the local component. The spatial component
  is modeled as a Gaussian field. The fit parameters,
  and
and  , respectively tune how distances between neighbors and the streets define the spatial dependency between households in the spatial component.

