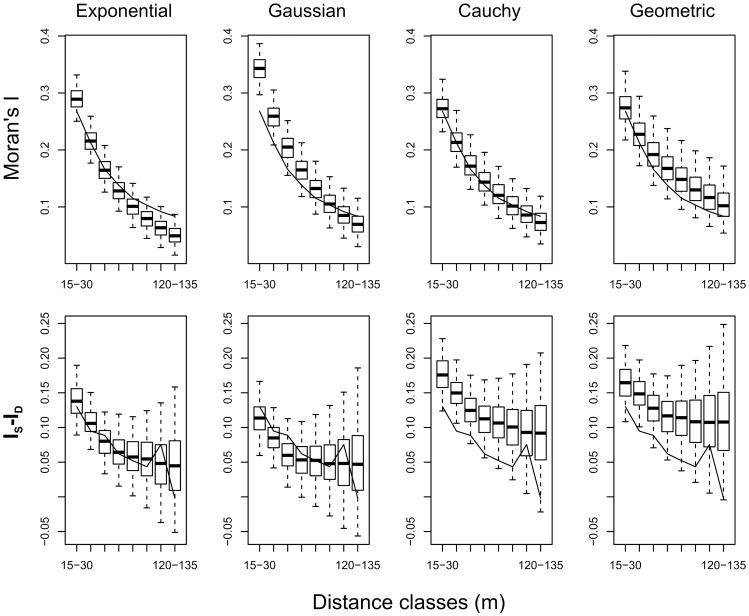
Figure 4. Spatial autocorrelation of data simulated with the Gaussian Field Latent Class model of Triatoma infestans distribution.
The autocorrelation of infestation in the generated data is compared to the autocorrelation in observed data. Infestation data were generated on the validation map using the estimated parameters for each of the kernels: exponential (first column), Cauchy (second column), Gaussian (third column), and geometric (fourth column). We calculated the standard Moran's I (first row) and the difference  between within block and across street autocorrelation (second row) as a function of distance. The solid line indicates the values for the observed data. Box plots indicate the values obtained from generated data. The boxes indicate the
  ,
,  and
and  quantiles, and the whiskers depict the 95% CrI.

