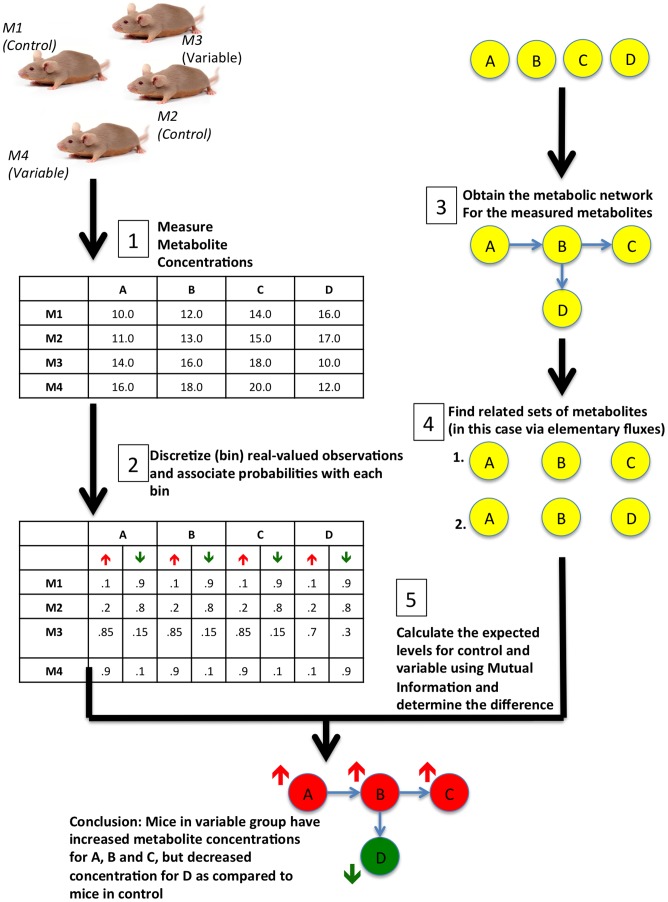
Figure 1. An overview for ADEMA.
The first step is to construct a population such that it contains multiple individuals (in this case M1 and M2 who are in control group versus M3 and M4 who are in variable group. Concentrations of metabolites of interest are determined for all individuals (in this case concentrations of metabolites A, B, C and D). Then for the second step, each observation is assigned a probability to be in a discrete bin (we only consider two bins, namely, up or down). Third step is to construct the metabolic network to determine the associations between measured metabolites. In this figure circles represents metabolites and arrows represent the reactions that relate metabolites. This is followed by the fourth step that determines the subsets of metabolites, which are related in the metabolic network. We have found two sets, <A, B, C> and <A, B, D>, are the only subsets that are related. Using the probabilities found in step 2 and related subsets found in step 4, ADEMA determines control- and variable-specific metabolite levels (bins) and compares the changes in variable group with respect to mice in control group. In this example, ADEMA concludes that A, B and C are increased, and D is decreased in the variable group as compared to control mice.

