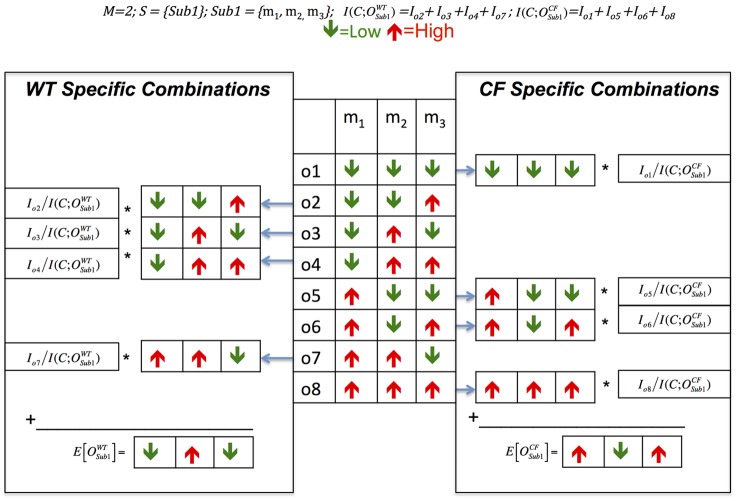
Figure 3. Illustration of determining WT and CF specific metabolite level combinations.
Three metabolites are being analyzed to determine their expected levels for WT and CF. In this example, there is just one subset of metabolites considered, and there are two bins (e.g., either up or down). There are 23 possible combinations of ups and downs. Using the function ClassifyCombination, it is determined that combinations o2, o3, o4, and o7 are WT-specific (on the left) and combinations o1, o5, o6, and o8 are CF-specific (on the right). When sets of combinations are weighed separately by their marginal information, expected levels for these metabolites for CF and WT are found.

