
Figure 5. Results of gene expression analysis and flux measurements on DNL pathway.
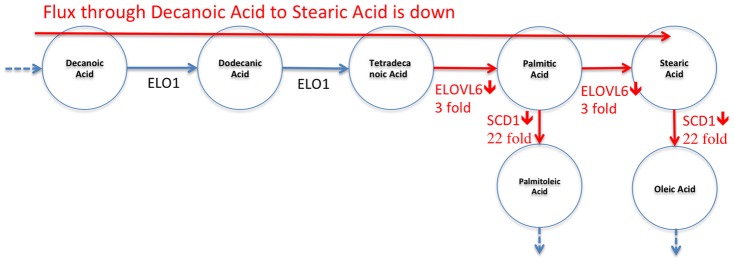
Circles represent the corresponding metabolites, and arrows represent reactions. ELOVL6 and SCD1 are the genes that express enzymes, which catalyze the corresponding reactions. This independent wet-lab study shows that (i) flux through Decanoic Acid to Stearic is decreased, and (ii) the shown genes that catalyze corresponding reactions are down-regulated in 3-week-old CF mice.