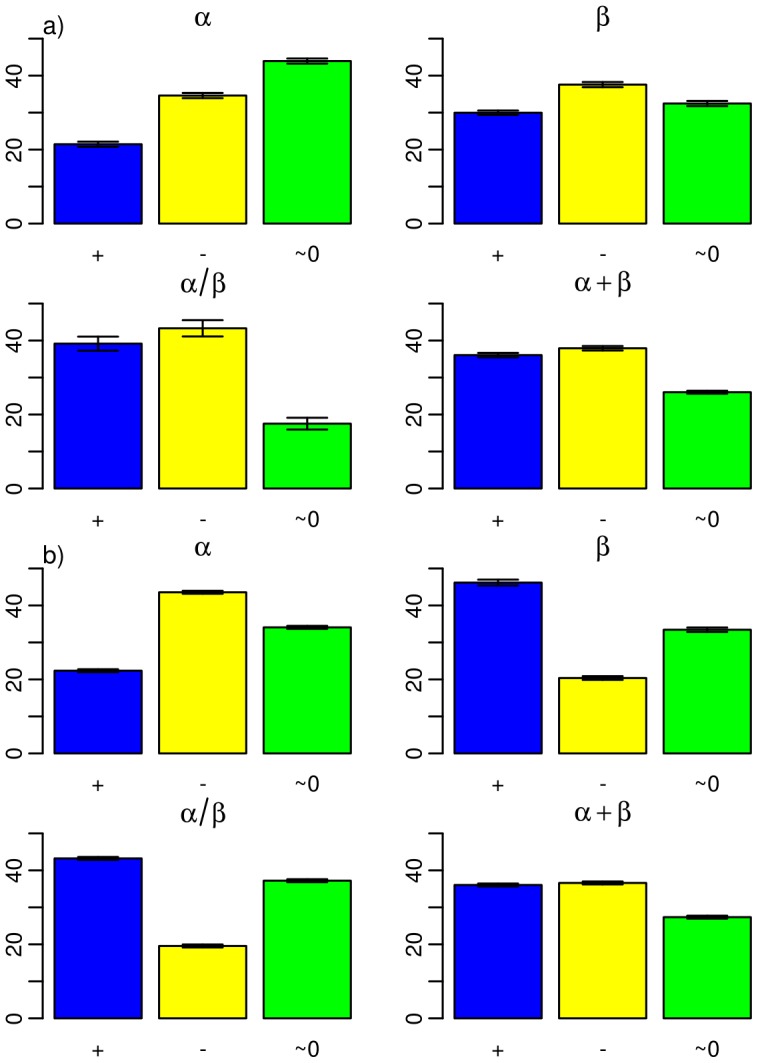
Figure 4. Percentage of all domains with a positive (blue), negative (yellow), and insignificant (green)  SMCO.
SMCO.

a) for 3.8- 1.5 Gya, and b)
  1.5-0 Gya. Each barplot considers one of the four fold classes according to their secondary structure: all-
 , all-
 ,
,  /
/ , and
, and  +
+ , as indicated. The barplots were obtained from domain length distributions analogous to those shown in Figure S3.
