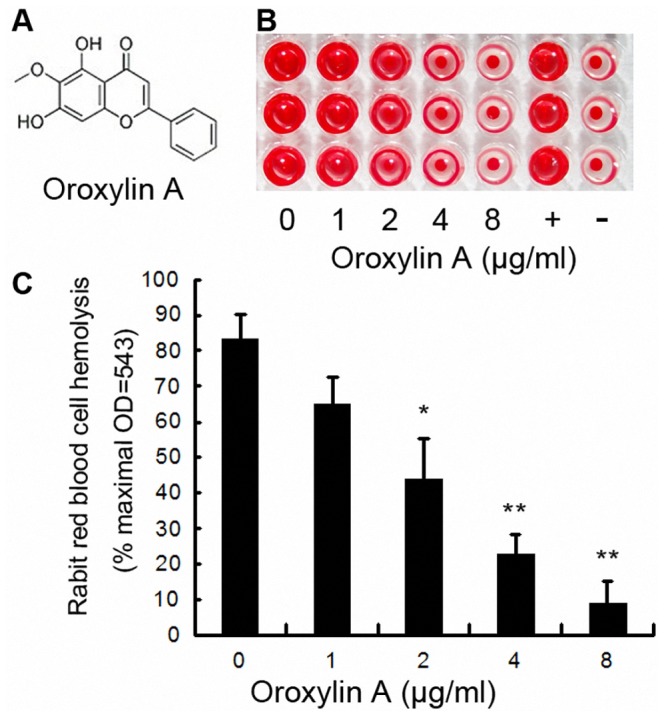
Figure 2. Inhibition of α-HL-induced hemolysis.

A, Chemical structures of ORO; B and C, Hemolysis assays were performed with purified α-HL using rabbit red blood cells in PBS. Bars show the mean values of three independent assays (n = 3). Error bars show the standard deviations (SD). * indicates P<0.05 and ** indicates P<0.01 compared to the drug-free group.
