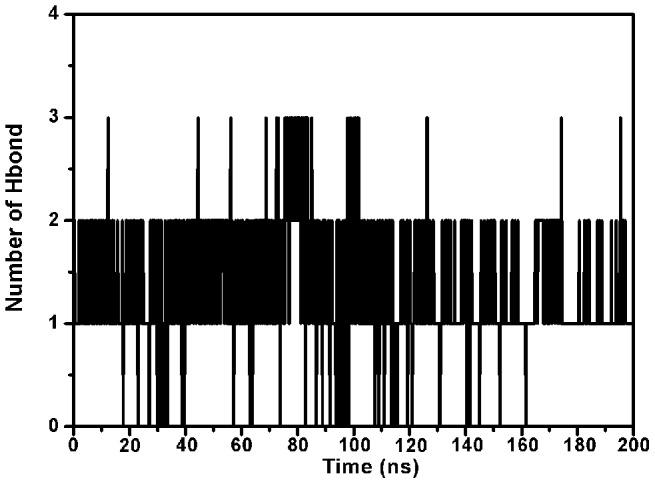
Figure 4. The number of H-bonds between ORO and α-HL during the 200-ns simulation.

During the simulation time, the number of hydrogen bonds fluctuates mostly between 1and 2, which indicates that there is always a hydrogen bond between ORO and α-HL.

During the simulation time, the number of hydrogen bonds fluctuates mostly between 1and 2, which indicates that there is always a hydrogen bond between ORO and α-HL.