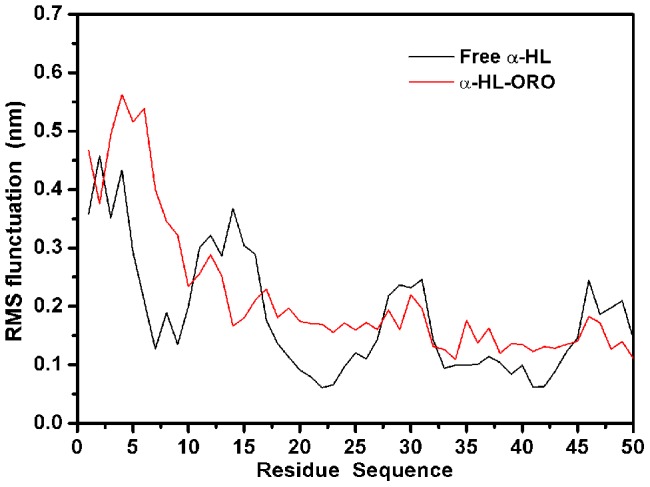
Figure 5. RMS fluctuations of the residues around the binding sites of the α-HL –ORO complex and free α-HL.

RMS fluctuations are defined as RMS deviations of the structure at a given time from the average structure found using the MD simulation. Only mobile atoms of the simulation were considered for the RMS fluctuations.
