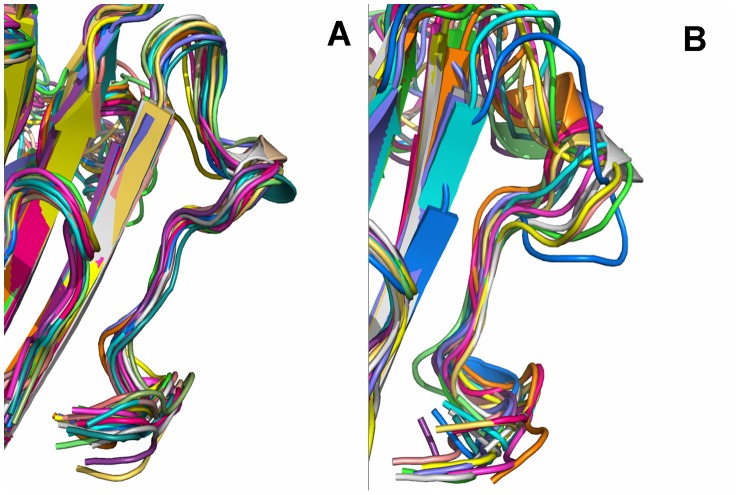
Figure 9. Significant differences were displayed in the dynamics of the critical “Loop” region during the last 20-ns simulations of the wild type-ORO and the free wild-type α-HL.
Ribbon diagrams of the conformations of the loop extracted from MD simulations are presented. The “Loop” is located below each image. 30 snapshots from the wild-type's MD simulation are displayed in (A); the free protein are displayed in (B). The snapshots were superimposed using the backbone atoms by Pymol software.

